The Data-Mapping Guide to Emotional Intelligence (EQ) for Project Managers
(Yes, you read that right — EQ + Data Mapping. Put down the Gantt for a moment.)
In the world of projects, we're used to mapping data: dependencies, flows, stakeholders, resources. But one map often overlooked is the emotional-data map: how feelings, moods, and responses flow through your team, your stakeholders, and your environment. When we become better at mapping that, we unlock a quieter superpower: strong EQ.

7 Ways to Check Your Team’s Pulse
(And improve their output and happiness.)
As you've seen on this blog in posts about leadership style (link here → your posts on leadership-style), style matters. But style minus emotional astuteness = paint without primer. Here are 7 things project managers (and mentors) need to do to map emotional data and integrate EQ into their work effectively.
For each point, I'll give a brief explanation, a practical tip (think of it as your key takeaway), and an example (because we all love stories).
Create an “EQ score card” tailored to your team.
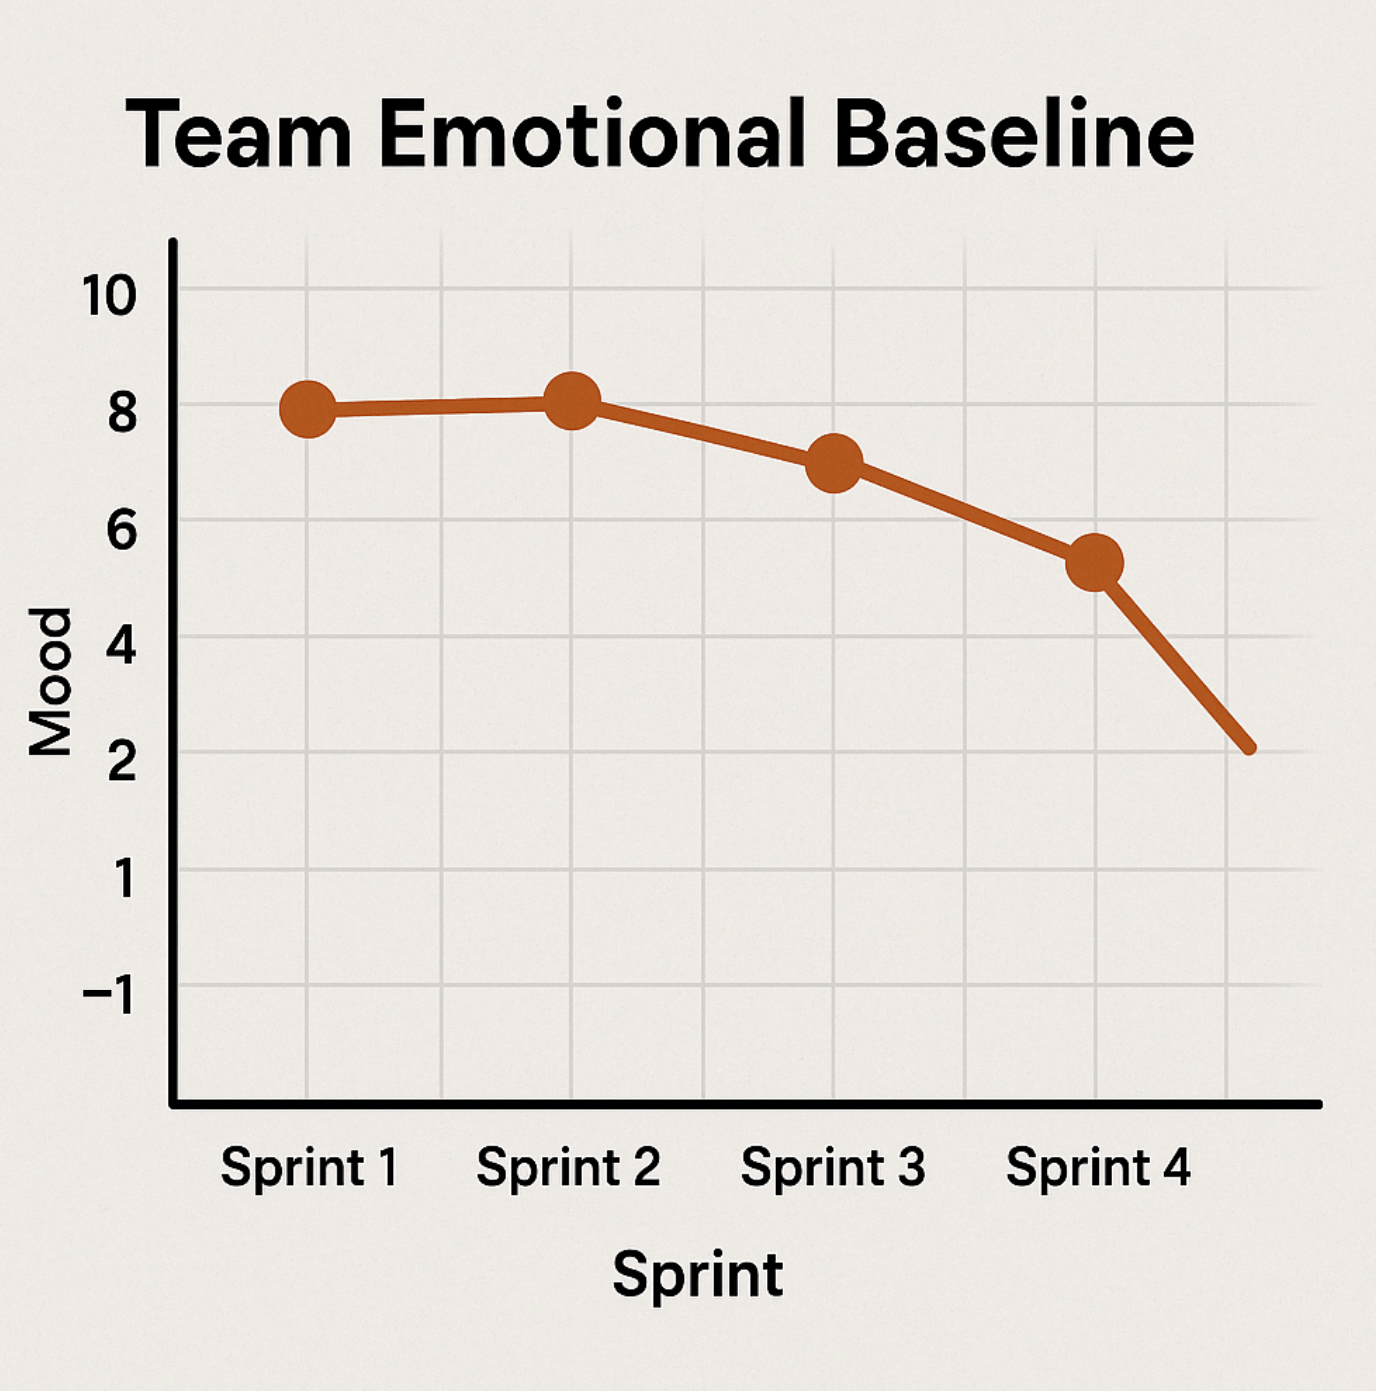
1. Map the "Emotional Baseline" of Your Team
Before you can chart a deviation, you need to know what 'normal' is. The emotional baseline is the typical mood, confidence level, stress level, and relational tone of your team. Recognizing these can help team members feel understood and valued, strengthening trust. Research shows that teams led by managers with higher emotional intelligence show better cohesion, communication, and productivity.
Key Takeaway: At the start of each milestone or sprint, ask a "mood check" anonymous question: On a scale of 1-10, how energised do you feel about work? Capture responses and track over time.
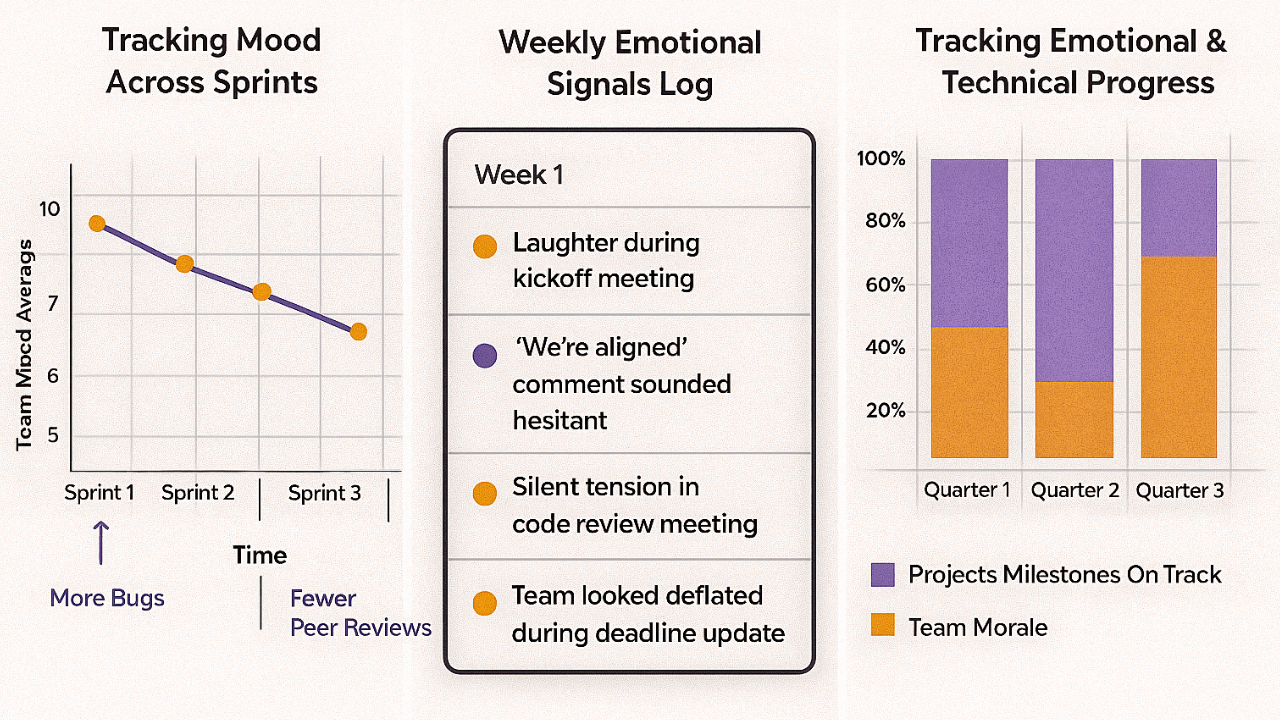
Example: Sarah, the PM, notices that in Sprint 1 her team's average mood is "8 – excited", but by Sprint 4 it's "5 – meh". She maps that drop alongside higher bug counts and fewer peer code reviews. That insight cues her to talk with her team about what changed. Was it scope creep or maybe unclear roles? Rather than simply pushing harder, Sarah's goal is to fix the underlying issues.
2. Capture Emotional Signals in Your Data Flow
In project maps, you trace workflows, dependencies, and deliverables. In emotional maps, you trace signals: micro-conflicts, body language, tone shifts, passive resistance. Spotting these signals helps team members feel seen and acknowledged, promoting openness. One study found that managers' emotional intelligence correlates with better project success because these signals are spotted and addressed.
Key Takeaway: Build a mini "emotion log" into your weekly check-in: note one thing you observed about team emotions (e.g., "Jamie made a joke when we raised risk X — looked forced"), then consider: What might that be signalling?
Example: At a stakeholder meeting, Raj notices that when the senior sponsor says "we're aligned," her voice rises at the end (in a question tone). Raj logs: "Sponsor might not be fully on board". To address the concern, he plans a one-on-one conversation and discovers the sponsor indeed has reservations the team didn't know about. Now, Raj and the team can address the disconnect and get aligned, but this time, really.
3. Map Emotional Dependencies
It’s important to know who influences whom. In your standard project map, you know that Task B depends on Task A, and Team Y depends on Team X. On the emotional map, you identify the informal influencer. Recognizing these influences can make team members feel influential and understood, increasing engagement. Who sets the mood? Who's the 'silent resistor'? Because ignoring these emotional links is like ignoring a hidden dependency that can crash your schedule.
Key Takeaway: Draw a simple "emotional dependency/influence diagram" for your team: nodes = team members or stakeholders; arrows = "I listen to this person / this person affects my mood or decisions". Identify at least 2 key influencers (positive or negative).
Example: Maria draws her map: She spots that although the official sponsor is John, the real emotional influencer is Linda (the long-tenured ops manager). Every time Linda's unhappy, the team slows. Maria begins to engage Linda directly, give her a heads-up before big decisions, and asks her input. That cuts down resistance.
4. Map Emotional Risk Points
Yes, Stress Can Blow up Your Team. You map technical and schedule risk — same for emotional risk. But emotional mapping can be complex due to hidden biases, cultural differences, or reluctance to share feelings. Recognizing these challenges helps you develop strategies to build trust and ensure honest emotional data collection, increasing your chances of success.
Key Takeaway: For each major milestone or decision gate, build an "emotion risk checklist": e.g., "Is team clear on scope? Has budget pressure been communicated? Are there new remote folks?" Use this to trigger a pre-mortem: What emotional stressors might come into play?
Example: Two weeks before go-live, Tony runs his checklist and realises the development team hasn't been told about the overtime expected. That's a known trigger. He organises a brief "what to expect" session, addresses moral concerns, and avoids a morale drop at crunch time.
5. Map Emotional Data into Stakeholder Communication
Your communication map for stakeholders usually lists deliverables, timing, and costs. But we seldom map how those stakeholders feel, what their emotional state is, or what motivates them. Research in project management indicates that PMs who use EI in stakeholder management deliver better outcomes.
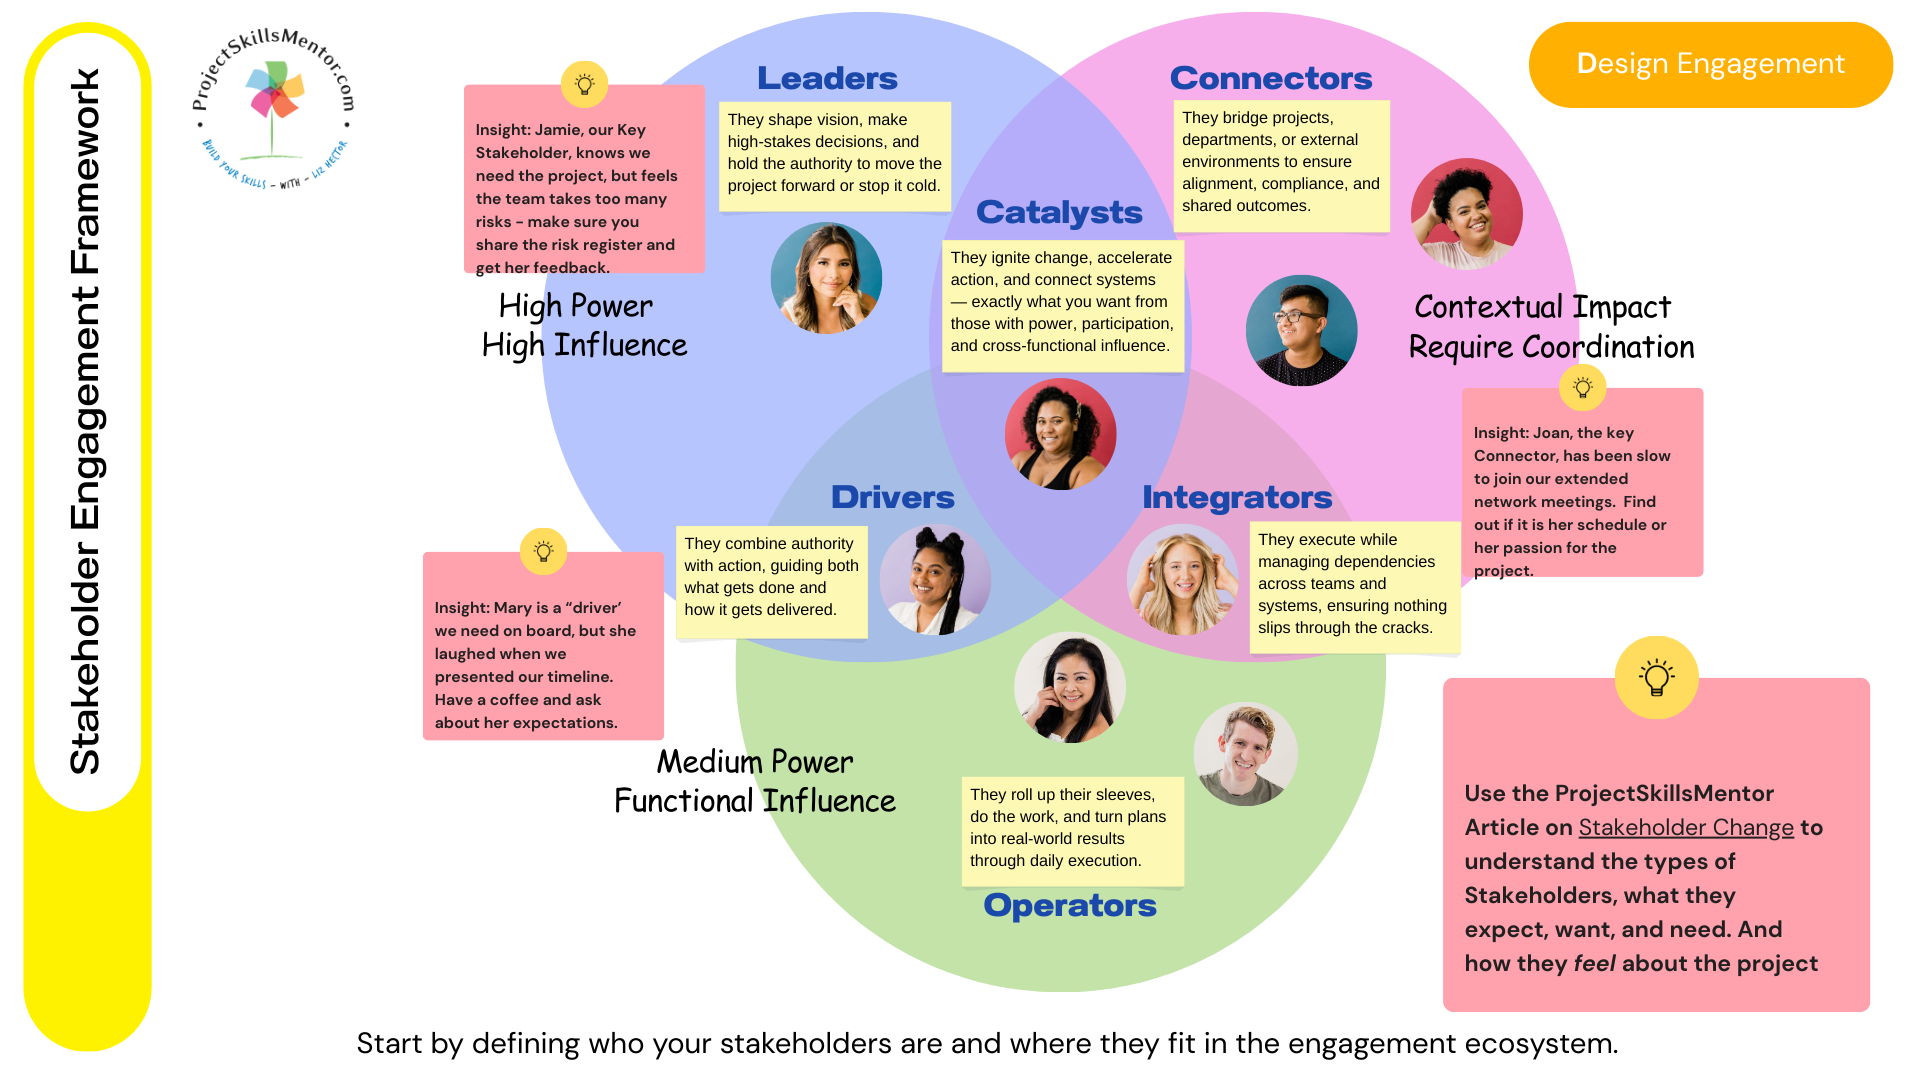
Key Takeaway: Create a stakeholder relationship map. Track the key aspects of each relationship and how EQ-savvy can improve it. Sandra: values being consulted, feels under-resourced, dislikes surprise changes. Then tailor your next communication accordingly.
Example: Mark has a stakeholder, "Colin", who gets anxious if plans shift without his input. On a change request, Mark tags Colin first with a "heads-up" and invites his feedback — rather than CC-bombing. Colin feels included, doesn't rebel, and the change passes smoothly.
6. Map Emotional Progress alongside Technical Progress
Is Your Team Hitting a Wall?
You track deliverables, percent complete, and burn rate. But without tracking emotional progress (team confidence, morale, stakeholder buy-in), you miss part of the story. Studies suggest that high EQ among project leads correlates with higher success rates.
Key Takeaway: Add an "EQ KPI" into your status report: e.g., "Team morale: high/medium/low", "Stakeholder disturbance: none/medium/high". Over time, you'll see if emotional health is trending down even if deliverables look okay.
Example: Quarterly status shows: Major milestones on track, but team morale is low to medium. Rather than ignoring the flag, a good manager like Angie pauses to hold a team retrospective. Find out what's draining energy? Remote members feel disconnected? Great, now she knows and can fix that.
7. Map Your Own Emotional State
Yes, you, the Manager. You are the hub of the map. If you're stressed, reactive, or tone deaf, everything else suffers. Leading style is connected with EQ. If you're not mapping your own emotional data, you're basically flying blind in turbulence.
"Emotional intelligence is the key to both personal and professional success."
— Daniel Goleman, a Psychologist and Author on EQ.
Key Takeaway: At the end of each week, ask yourself: What one emotional reaction did I have that surprised me? What could I have responded differently? Keep a personal " emotional journal". Over time, you'll spot your own triggers and patterns.
Example: Dave realises he snapped at a junior when the schedule slipped. His journal notes: "Felt embarrassed about slip, reacted with anger; next time I'll pause and ask team what's really happening." Over time, he notices his pattern: deadline pressure + public update = reaction. He changes his behaviour, and team engagement improves.
Connect Back to Leadership Style

How you lead isn't just what you do; it's how you do it. Mapping emotional data adds the how you feel and how others feeldimension. Leadership style + emotional mapping = stronger alignment, fewer surprises, higher resilience.
So listen to your inner leader and lean into your natural style. Being authentic at work is a big part of how your EQ is expressed and serves as a role model for others. When everyone is free to be themselves while learning to engage as a team, we find the flow, the effortless place of transformational productivity. And that management utopia!
Why EQ Impacts Project Output
Mapping emotional data isn't some touchy-feely bonus — it's strategic. Because facts, Gantt charts, dashboards? They don't capture micro-understandings, silent disengagements, or subtle influencers. But those quietly kill projects.
Your Key Takeaway: Treat emotional intelligence like a dataset—gather a baseline, track over time, map dependencies and risk points, integrate it into your communication and status flows, and include yourself in the map. Do that, and you're not just managing projects—you're leading them with real insight.